
Data Visualisation
What we offer.
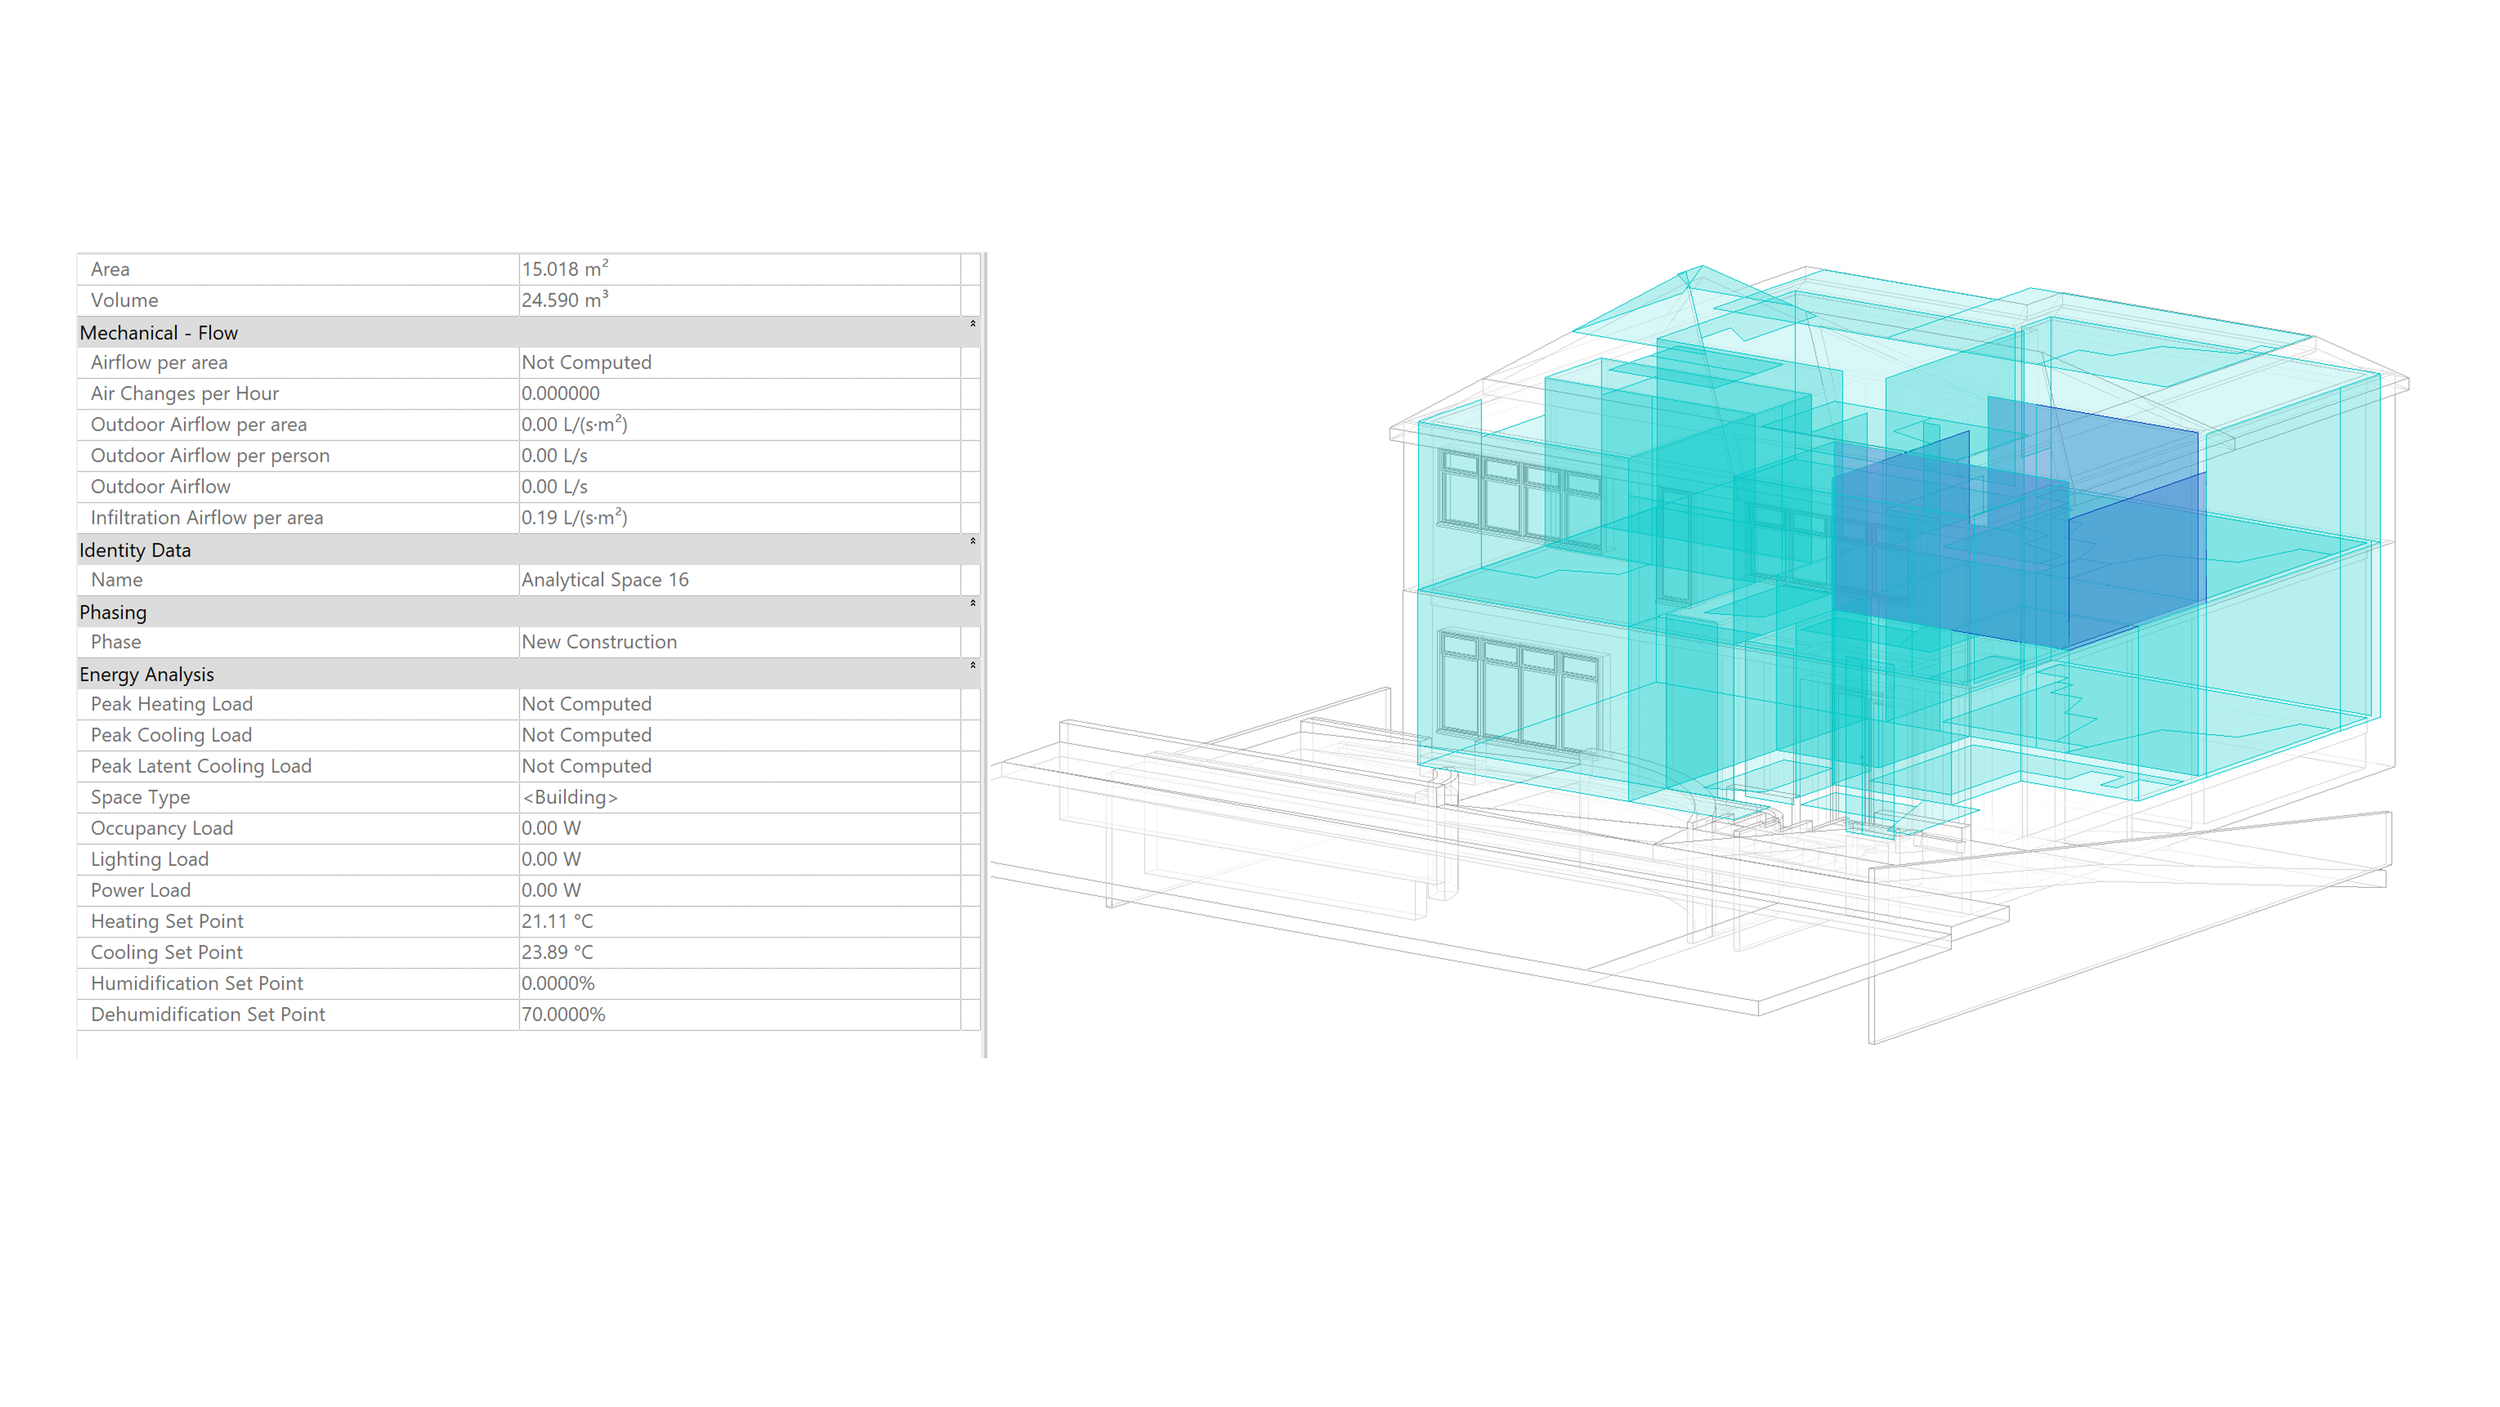
Pixel is able to visualise your datasets made on Excel, Access, JSON, Text and PDF. We are able to extract data from CAD files we create for you, to show statistics such as cost of materials, smart home systems, energy consumption and much more.
This data is presented in a dashboard, also able to show forecasting and analytics for future decision making and recommendations.
We can work with datasets millions of rows at a time, to make your data more user-friendly and cost saving.
For a detailed overview and specific examples to your type of work, please contact us for a free consultation using the link in the navigation at the top of the page.

BI Tools
Using Tableau and Microsoft PowerBI, we are able to create detailed dashboards of various graphs, infographics and statistics to clearly present the most important aspects of your data.
Highlighting key figures provides perfect clarity for decision-making, without scrolling through millions of rows.
When combined with our CAD Models, these tools make clear where money can be saved across the lifecycle of your project.
Please see below some examples of dashboards compared to the original datasets they came from, with testimonials from the clients who benefited from this work.
Blockchain Analysis
Client
Enigma Ltd.
Year
01/12/2021
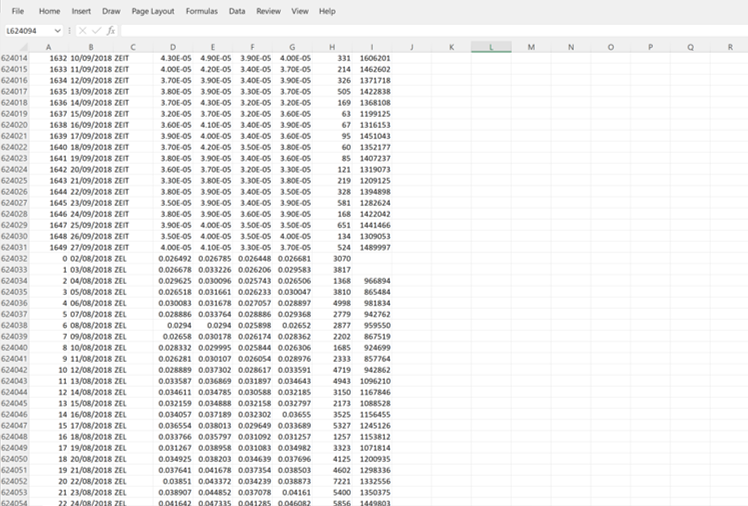


Excel Spreadsheet containing >600,000 rows of data, from 2008-2020
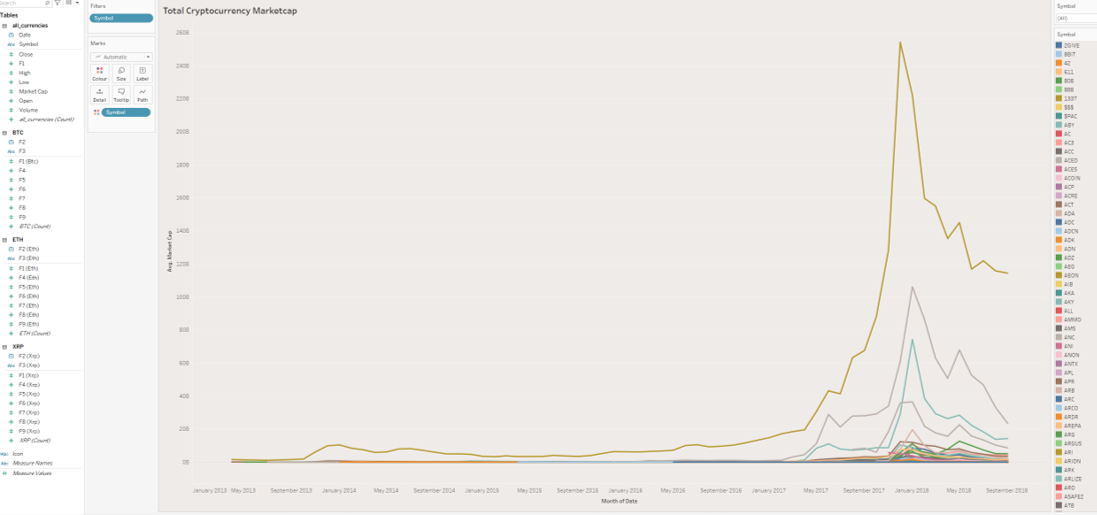
Market cap of all 3000+ Tokens shown on a single graph.
“Unbelievable how easy it is to use and how much money it has saved us”
“Highly recommend to any with countless rows of data like we do!”
Final Dashboard sent to client
Download for yourself here!
https://public.tableau.com/views/CryptocurrencyHistoricalData_16599892472150/Dashboard2?:language=en-GB&:display_count=n&:origin=viz_share_link
Dashboard Portfolio
NYC Top AirBNB picks
Client
Timed
Year
15/09/2021
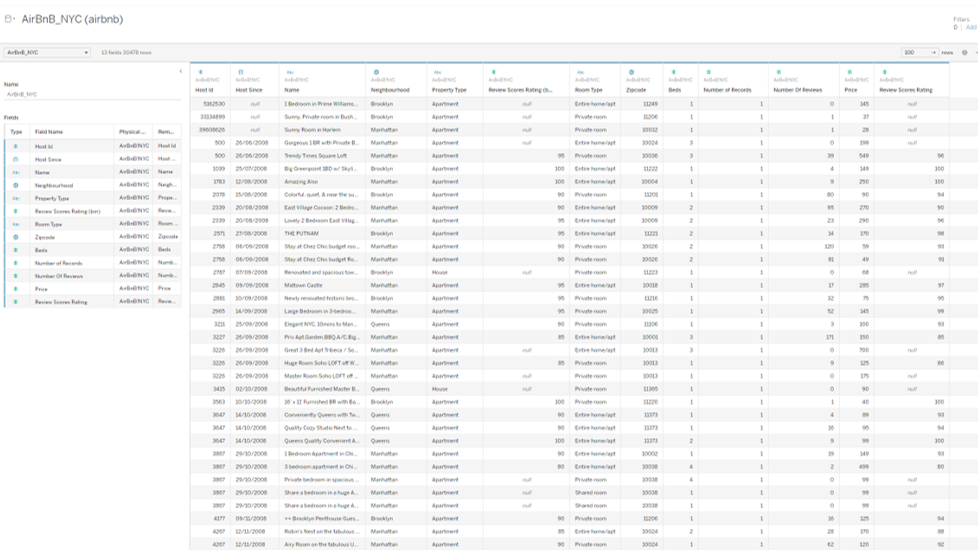
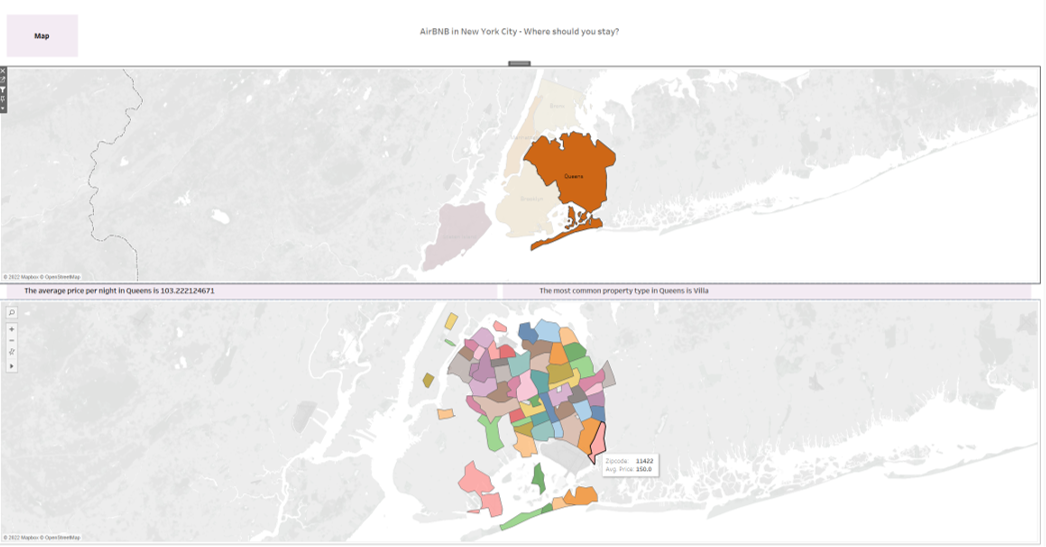


Large spreadsheet of figures integrated into Tableau.
All locations on the spreadsheet shown within global parameters.
Final Dashboard of information
“Made it much easier to present to our clients the best spots for them to stay in and around NYC”
Download for yourself here!
https://public.tableau.com/views/AirBNBinNYC1stIteration/Dashboard1?:language=en-GB&:display_count=n&:origin=viz_share_link